Note
Click here to download the full example code
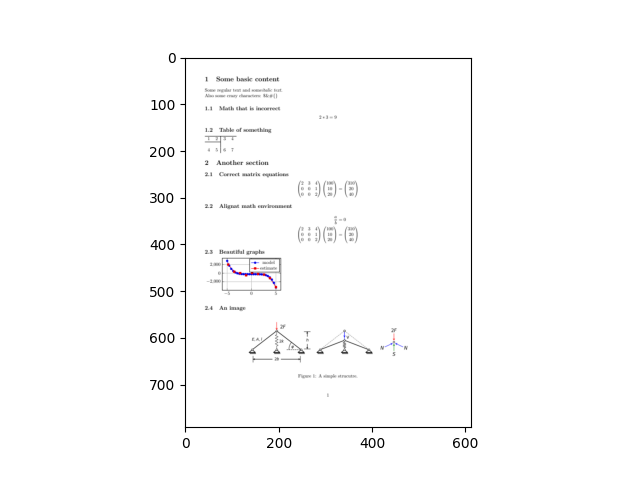
Basic Example
An example highlighting the main differences between pylatex and latexdocs.
# This code is a copy of the following example:
# https://jeltef.github.io/PyLaTeX/current/examples/full.html

import numpy as np
from pylatex import Document, Section, Subsection, Tabular, Math, \
    TikZ, Axis, Plot, Figure, Matrix, Alignat, NoEscape
from pylatex.utils import italic
import pypdfium2 as pdfium
import matplotlib.pyplot as plt

image_filename = 'image.png'

geometry_options = {
    "tmargin": "1.5cm",
    "lmargin": "1.5cm",
    "rmargin": "1.5cm"
}
doc = Document(geometry_options=geometry_options)

with doc.create(Section('Some basic content')):
    doc.append('Some regular text and some')
    doc.append(italic('italic text. '))
    doc.append('\nAlso some crazy characters: $&#{}')
    with doc.create(Subsection('Math that is incorrect')):
        doc.append(Math(data=['2*3', '=', 9]))

    with doc.create(Subsection('Table of something')):
        with doc.create(Tabular('rc|cl')) as table:
            table.add_hline()
            table.add_row((1, 2, 3, 4))
            table.add_hline(1, 2)
            table.add_empty_row()
            table.add_row((4, 5, 6, 7))

a = np.array([[100, 10, 20]]).T
M = np.matrix([[2, 3, 4], [0, 0, 1], [0, 0, 2]])

with doc.create(Section('Another section')):
    with doc.create(Subsection('Correct matrix equations')):
        doc.append(Math(data=[Matrix(M), Matrix(a), '=', Matrix(M * a)]))

    with doc.create(Subsection('Alignat math environment')):
        with doc.create(Alignat(numbering=False, escape=False)) as agn:
            agn.append(r'\frac{a}{b} &= 0 \\')
            agn.extend([Matrix(M), Matrix(a), '&=', Matrix(M * a)])

    with doc.create(Subsection('Beautiful graphs')):
        with doc.create(TikZ()):
            plot_options = 'height=4cm, width=6cm, grid=major'
            with doc.create(Axis(options=plot_options)) as plot:
                plot.append(Plot(name='model', func='-x^5 - 242'))

                coordinates = [
                    (-4.77778, 2027.60977),
                    (-3.55556, 347.84069),
                    (-2.33333, 22.58953),
                    (-1.11111, -493.50066),
                    (0.11111, 46.66082),
                    (1.33333, -205.56286),
                    (2.55556, -341.40638),
                    (3.77778, -1169.24780),
                    (5.00000, -3269.56775),
                ]

                plot.append(Plot(name='estimate', coordinates=coordinates))

    with doc.create(Subsection('An image')):
        with doc.create(Figure(position='h!')) as pic:
            pic.add_image(image_filename, width='350px')
            pic.add_caption('A simple strucutre.')

doc.generate_pdf('basic_example_pylatex', clean_tex=False, compiler='pdflatex')

pdf = pdfium.PdfDocument("basic_example_pylatex.pdf")
page = pdf.get_page(0)
pil_image = page.render_topil()
plt.imshow(pil_image)
<matplotlib.image.AxesImage object at 0x7f33d406e9d0>
Now the same using latexdocs to have a little bit more control over when and what we do:
from latexdocs import Document, TikZFigure, Image

doc = Document()

doc['Some basic content'].append('Some regular text and some')
doc['Some basic content'].append(italic('italic text. '))
doc['Some basic content'].append('\nAlso some crazy characters: $&#{}')
doc['Some basic content', 'Math that is incorrect'].append((Math(data=['2*3', '=', 9])))

content = Math(data=[Matrix(M), Matrix(a), '=', Matrix(M * a)])
doc['Another section', 'Correct matrix equations'].append(content)

table = Tabular('rc|cl')
table.add_hline()
table.add_row((1, 2, 3, 4))
table.add_hline(1, 2)
table.add_empty_row()
table.add_row((4, 5, 6, 7))
doc['Some basic content', 'Table of something'].append(table)

agn = Alignat(numbering=False, escape=False)
agn.append(r'\frac{a}{b} &= 0 \\')
agn.extend([Matrix(M), Matrix(a), '&=', Matrix(M * a)])
doc['Another section', 'Alignat math environment'].append(agn)

fig = TikZFigure(plot_options='height=4cm, width=6cm, grid=major')
fig.append(Plot(name='model', func='-x^5 - 242'))
coordinates = [
    (-4.77778, 2027.60977),
    (-3.55556, 347.84069),
    (-2.33333, 22.58953),
    (-1.11111, -493.50066),
    (0.11111, 46.66082),
    (1.33333, -205.56286),
    (2.55556, -341.40638),
    (3.77778, -1169.24780),
    (5.00000, -3269.56775),
]
fig.append(Plot(name='estimate', coordinates=coordinates))
doc['Another section', 'Beautiful graphs'].append(fig)

img = Image(filename=image_filename, position='h!',
            caption='A simple structure.', width='350px')
doc['Another section', 'An image'].append(img)

doc.build().generate_pdf('basic_example_latexdocs', clean_tex=True, compiler='pdflatex')

# Take a look at the generated file

pdf = pdfium.PdfDocument("basic_example_latexdocs.pdf")
page = pdf.get_page(0)
pil_image = page.render_topil()
plt.imshow(pil_image)

<matplotlib.image.AxesImage object at 0x7f33d467fac0>
Total running time of the script: ( 0 minutes 4.842 seconds)